Working with timezones
I do enjoy thinking about some of the strange things that can happen with time and timezones and it can be amusing, and occasionally useful, to read some lists of counterexamples to reasonable-sounding statements about time, but it’s hard to actually get stuff done with this information alone. All those counterexamples might leave you thinking that dealing with timezones is basically impossible to get right, whereas in fact it’s not that difficult once you draw the right pictures. I thought it’d be useful to share the pictures I find helpful when approaching timezone-related problems.
Local-universal time graphs
The basic tool for visualising a timezone is something I’m going to call a local-universal time graph (LUTG) which sounds awfully fancy but is really just a line graph that relates universal time (on the horizontal axis) to local time (on the vertical axis). The LUTG for the standard UTC timezone looks like this:
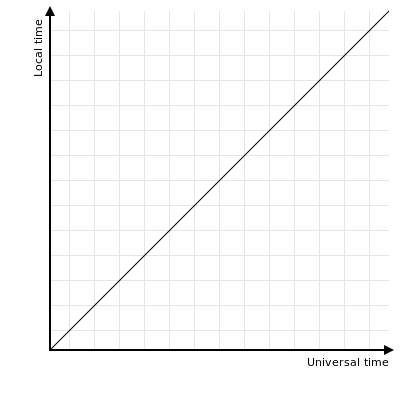
If you think this looks fairly boring then you’d be right. UTC is a fairly
boring timezone, and its LUTG reflects this perfectly. A marginally more
interesting timezone is something like
Etc/GMT-4 whose LUTG looks like
this:
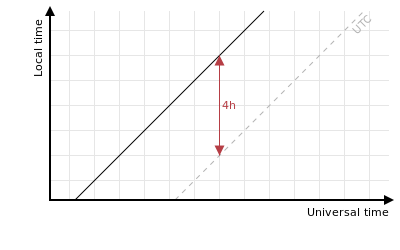
This is still quite boring, admittedly, but it does at least show you
unambiguously whether to add or subtract the 4 hours necessary to convert from
local time to UTC or vice versa. The correct interpretation of the sign of a
timezone offset is just not a thing that seems to stay in my head, and the fact
that what the IANA call Etc/GMT-4 is called +04:00 by the ISO suggests that
there are other people who also struggle with this. So I draw this LUTG and I
find it helps.
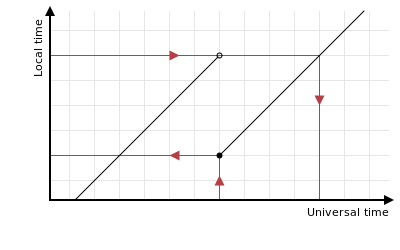
Changing offsets
The fun and games really begin when you start to look at timezones that sometimes change their offsets from UTC. This happens in two different ways. Either they set their clocks forwards …
… or they set them back …

Properties of LUTGs
There’s a few things to notice about these graphs. Firstly, every UTC instant has a well-defined local time to which it corresponds:
Some local times also have a single well-defined universal time to which they correspond:
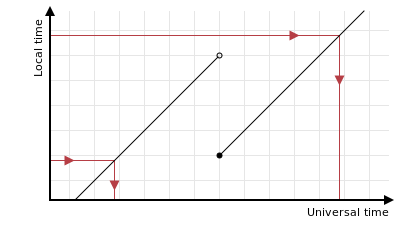
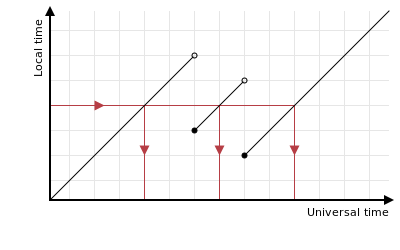
However when the clocks go back, some local times have two corresponding UTC times:
Similarly when the clocks go forwards, some local times never occur at all:
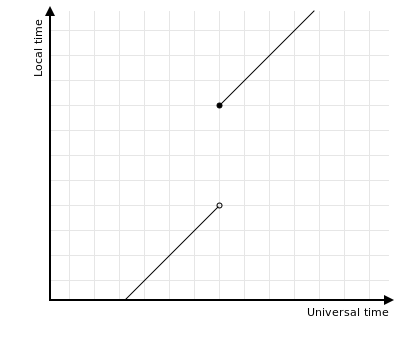
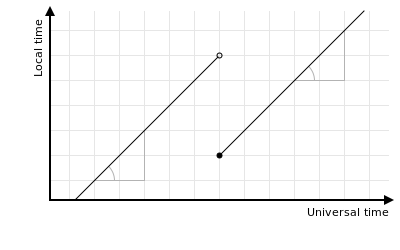
Away from the offset transition, time proceeds at the same rate on both axes: all the lines are at 45°.
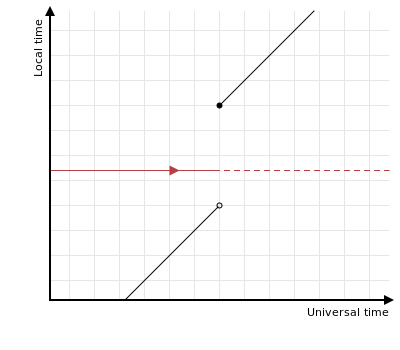
One thing that’s perhaps not obvious from the graph, but which can be important, is that the transition time belongs only to the later line segment. Times strictly before the transition time have the earlier offset, and times that are equal to or later than the transition time have the later offset. I draw this with an open ○ at the exclusive endpoint and a filled ● at the inclusive endpoint.
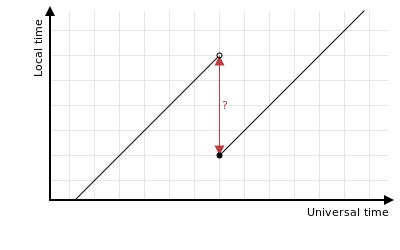
Offsets are vertical
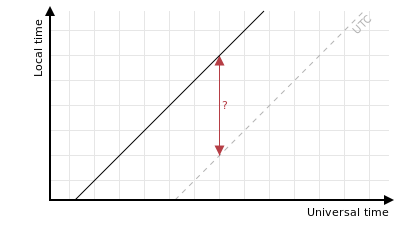
An important point is that offsets from UTC are drawn as the vertical distance between the line and the LUTG of UTC:
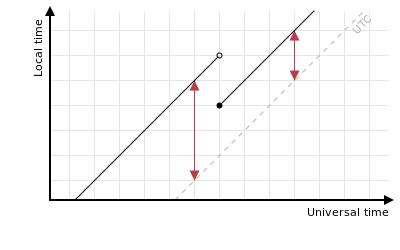
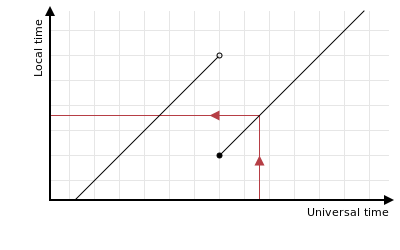
I think this point is absolutely crucial to fully understanding timezone calculations. It’s tricky because most of the time the vertical distance is the same as the horizontal distance:
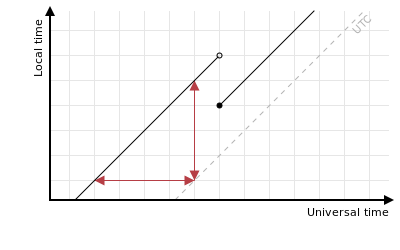
But near to a transition this isn’t true, even where the horizontal distance is unambiguous and well-defined:
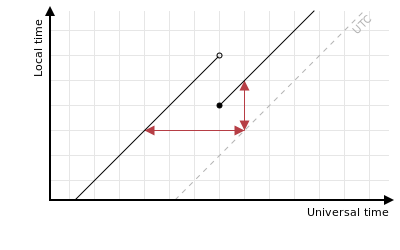
It’s very easy to write plausible-looking code that confuses horizontal and vertical offsets which gives undesirable results near to transitions.
When do transitions occur?
In many timezones there’s two transitions a year, approximately 6 months apart, that respectively set the clocks forwards and back by an hour. These transitions are a long way apart, and do not shift the clocks by very much, so they don’t really interact in most calculations. But what if the transitions were closer together, and larger, so that a local time might occur three times?
In theory it’s possible for this to happen, but it hasn’t yet, and would be a
slightly strange thing for a government to decide on. Still, who knows if it’ll
happen in the future? APIs like
java.time.zone.ZoneRules#getValidOffsets
do allow for this to occur. The closest two transitions in the current database
occurred three days apart in Europe/Warsaw on 1944-10-01 and 1944-10-04.
There are other things to remember when thinking about when transitions happen:
-
the southern hemisphere starts each year in summertime, so the forwards/backwards shifts of their clocks is the other way round from timezones in the northern hemisphere
-
timezones near to the equator may not shift their clocks at all
-
timezones such as Morocco’s sometimes change their clocks 4 times a year, returning to standard time for the duration of Ramadan.
-
timezones also occasionally perform an ad-hoc transition to change the alignment of their clocks with their neighbours. This might even divide a single timezone in two, if only part of the original timezone changes its rules. Indiana seems particularly prone to this sort of thing, and has its own subdirectory in the IANA timezone database because of it.
In short, it’s fairly hopeless trying to calculate when transitions might occur in any given timezone, or to expect there to be exactly two every year. You have to check the database provided by your operating system or libraries. Note also that the transition rules are set by a political process, so can change (sometimes at very short notice), which means you have to update your timezone database as new decisions are made.
Future transitions
Future entries in the timezone transition database are predictions — educated guesses based on a pattern of past behaviour — and subject to revision. This means it’s wrong to blindly convert all date-time values in your system into UTC for storage: human events like meetings (and legal events like deadlines) are normally given in local time, and you cannot know for certain the UTC offset that will be in force at the time of a future event, so prematurely converting future local times to UTC does not work.
Transitions in linked timezones
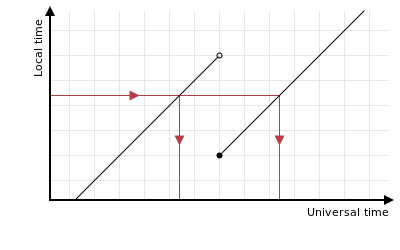
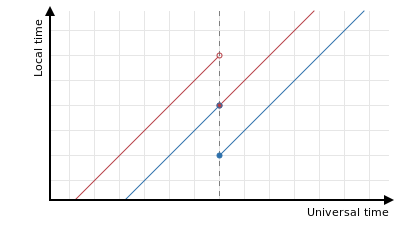
If you are working with multiple, linked, timezones then be aware of how their transitions are linked. In the EU, the clocks change at the same universal time (0100 UTC) which preserves the difference in offsets between neighbouring timezones:
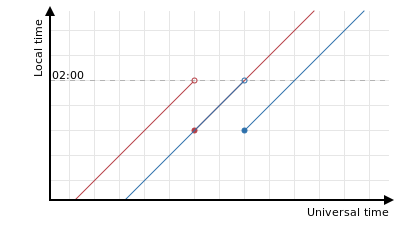
However, in North America, the clocks change at the same local time (0200) which temporarily changes the relative offsets between neighbouring zones:
Given that timezone offsets are agreed politically and subject to change, this kind of linkage is not very reliable. It’s much better to ignore it and to perform the calculations properly using the timezone database instead.
Sizes of offsets
The majority of offsets from UTC are a whole number of hours, but there are
many that aren’t. Historically, many timezones were set using solar time,
giving quite odd offsets indeed, but since 1980 all offsets in the IANA
database are a multiple of 15 minutes. The last one that wasn’t was
Pacific/Kiritimati which changed offset from -10:40 to -10:00 at midnight
on 1979-10-01. That’s not to say that a future change might introduce a
non-15-minute offset again, just that at the moment there aren’t any known
ones.
In a perfect world, all offsets would be between -12:00 and +12:00 from
UTC. However, the international date line is not straight, and islands near to
it seem to prefer to be on the Australasian side than the American side, so the
actual range of offsets found in practice is -12:00 to +14:00. Again,
that’s not to say that a future change might introduce an offset outside that
range, just that there aren’t any at the moment.
Sizes of transitions
Most regular transitions shift the clocks by a whole hour - in fact, the only
one I know not to is Australia/Lord_Howe which shifts the clocks by 30
minutes. Ad-hoc transitions can shift the clocks by any amount. The largest
clock changes I know of were in Antarctica/DumontDUrville which has sometimes
been in UTC and sometimes in UTC+10:00, with a ten-hour clock change at the
transitions. There have also been numerous transitions by ±24 hours as
timezones shift across the international date line in one direction or the
other, which aren’t strictly a clock change (they don’t affect the time of
day, just the day itself) but which still cause issues for software.
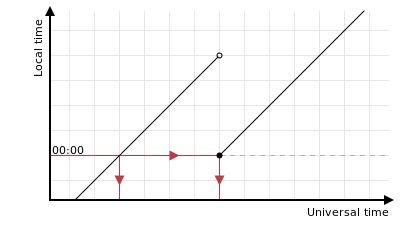
Effects on midnight and other special times
Since a transition can cause local times to be skipped or duplicated, beware of
issues caused by this affecting a “special” time like midnight. Most
transitions try and avoid affecting midnight like this, but there are timezones
like Atlantic/Azores which set the clocks back an hour at 01:00 local time
giving two midnights:
There’s also the mess caused by setting the clocks back just after midnight which makes the two days overlap in terms of their local times:
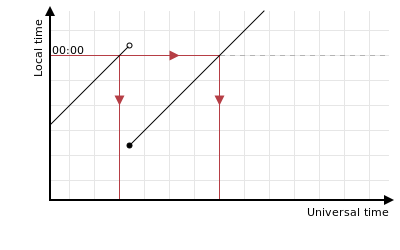
The opposite can occur if the clocks are set forwards just before midnight too:

In applications where there are other special local times, e.g. when trying to round a time to the nearest hour, beware of similar effects. Where offsets change by an amount that isn’t a whole multiple of an hour, you need to decide whether to keep rounding to the top of an hour, or to keep the intervals all an hour long, since you can’t do both.
Leap seconds
These diagrams treat universal time (UTC) as if it advances at a constant rate. In fact this isn’t true, it’s TAI that advances at a fixed rate, and UTC differs from TAI by a whole number of seconds that changes from time to time via the insertion of a leap second. In practice most data that you come across tends to have already dealt with leap seconds in one way or another, so a UTC-to-local diagram is appropriate. If the difference was important then it’d be fine to draw this kind of diagram with TAI on the horizontal axis instead of UTC.
Choosing a timezone
(addendum 2018-08-13) Redditor
/u/dbxp
points out that I omitted to talk about how to choose the appropriate timezone
for any given calculation, and gives the example of Jerusalem in which the
choice of timezone depends on more than just geography. A similar example to
this is that of the Mount Washington
Observatory
which apparently keeps to
Etc/GMT+5 even though
geographically it should be in America/New_York.
The choice of timezone is a human activity, so the only reliable way to choose a timezone is to expose the choice directly to a human being. Guessing it based on other factors is likely to fail for some of your users.
Additionally, using a proper timezone name in the UI for this is much better
than trying to abbreviate it cleverly. It’s hard to trust a UI that describes
the UK timezone as GMT, which suggests that it doesn’t correct for daylight
saving. It’d be nice if Microsoft didn’t do
this:
(GMT) Greenwich Mean Time: Dublin, Edinburgh, Lisbon, London
😭
Conclusion
A graph showing local time against universal time is a useful thing to draw if you have to work on some timezone-sensitive system and need help visualising all the things that might occur. With the right pictures, it’s much easier to get things right.