Zero-copy Paxos
The Linux kernel supports high-performance zero-copy processing of streams of
data by means of the splice() and
sendfile() system calls, which enable
the bulk movement of data as long as there is no need to inspect the content of
the data as it is processed.
Zero-copy Paxos is an implementation of a Paxos-based RSM that accepts, and writes to persistent storage, a sequence of streams of bytes. Importantly, in the steady state it has no need to inspect any incoming data, allowing it to make effective use of the high-performance zero-copy functionality available in Linux.
Data model
The system accepts and stores a sequence of data streams, where each stream is an arbitrarily long sequence of bytes sent by a single client and akin to a TCP connection or a non-sparse append-only file: the system may store a byte only if it has previously stored all preceding bytes in that stream, and there is no in-built notion of an atomic transaction larger than a single byte. Unlike TCP connections, the streams are not allowed to overlap: to avoid conflicts between concurrent writes, there is at most one active stream at any time.
Internal state machine
The system implements a replicated state machine (RSM) which achieves consensus on a sequence of actions to be performed on each replica of a deterministic state machine. Each action occurs in a numbered slot, and as each participant learns the value chosen in each slot it performs the corresponding action on its own local state machine.
There are a number of different
actions
that can go in a slot. Firstly there is a trivial no-op action which has no
effect on the RSM. The RSM also includes a counter used for consistently
allocating IDs to new nodes and there is a generate-node-id action to
increment this counter and yield the newly-generated node ID. The RSM also
includes the current configuration of the cluster, allowing nodes to be safely
added or removed as the system conditions require, and there are actions to
alter the current
configuration
in various ways. Finally, there is an action which writes a single byte to the
output stream, called a stream-content
action
and described in more detail here.
The data sent by the client to the current cluster leader is known as an input stream, which is a sequence of bytes that is numbered from position 0 at the start of the connection and which runs for arbitrarily long. The data that is stored durably by the system is known as an output stream. Each output stream is a nonempty initial subsequence of one of the input streams, although there is however no guarantee that an input stream will have a corresponding output stream. The input streams are given unique internal names ⟨stream owner node, sequence number⟩ but this is not exposed as part of the output. It is expected that clients will start each stream with some form of header record that describes the identity and content of the rest of the stream.
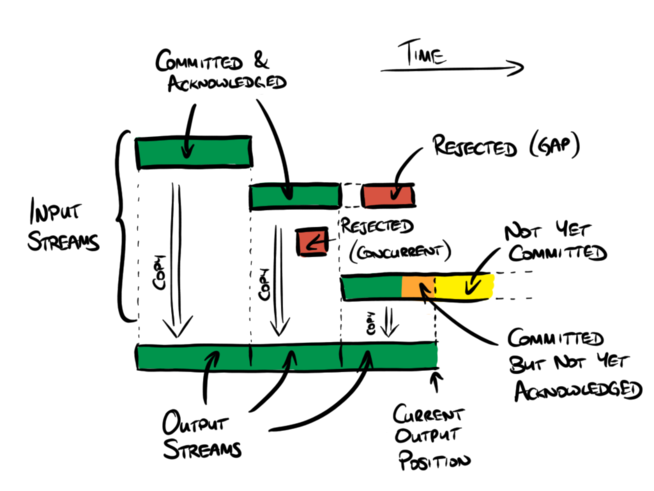
A stream-content log entry is effectively an instruction saying that the next
byte of output data should be copied from a specific position in a specific
input stream. If it is copied from the start of the input stream in question
then this starts a new output stream, closing any previously-active stream. If
it is not copied from the start of the input stream then all preceding data
from this input stream must immediately precede this byte in the output; if
this is not the case then the log entry is treated as a no-op, which is
necessary to ensure that the output comprises initial subsequences of the input
streams. Such no-op entries only occur when there is a leader re-election
leading to a gap in the chosen stream-content entries. There is no mechanism
for re-synchronising a stream once such a gap occurs: instead the stream is
simply closed and the client is expected to start a new stream to continue.
A stream-content log entry is a pair ⟨stream name, offset⟩
where the offset describes the difference between the slot number and the
position in the stream to which this entry pertains. Another possible design
would be to have the log entries be of the form ⟨stream name, position
in input stream⟩, but the advantage of describing the stream content in
terms of an offset is that the entries required to copy consecutive bytes from
input to output using consecutive slots are all equal, which enables a number
of useful optimisations described below.
Protocol
The protocol is based on UPaxos, with configurations defined using weighted majorities. It includes a pre-voting phase and the small-cluster optimisation, with further optimisations as described below.
Contemplate the contents of each phase 2 message in detail. Both
proposed+accepted
messages
and accepted
messages
comprise the term, the slot number, and the proposed log entry. Notice that
almost all of the time the term is constant and the slot number increases by 1
for each subsequent message. Since the communication between leader and
followers uses TCP the term and initial slot number can be sent once in a
connection, followed by a sequence of bare values, where each value implies the
corresponding proposed+accepted message.
Furthermore, when operating at load, nearly all log entries are
stream-content entries which comprise the stream name and an offset.
Proposals must also include the byte to be copied to ensure liveness. In the
(common) case of consecutive writes to consecutive slots, the stream name and
offset are constant so these, too, can be sent once at the start of the
connection. The resulting dataflow from leader to follower is an initial
start-streaming
message
comprising the term, initial slot number, stream name and offset, followed by a
sequence of single-byte messages that imply each consecutive
proposed+accepted message.
It is not necessary for a connection in this streaming mode to be able to return to a mode where it can send other kinds of message again. Instead, the system forms a new connection for further discrete messages and uses the streaming-mode connection where possible until it is no longer required. Because of this, and because the content of the connection is now simply the stream of bytes that are being proposed, there is no need for any extra framing: each message is simply a single byte.
In response, consecutive accepted messages typically have equal terms and
values and consective slot numbers, so it is more efficient to represent
accepted messages for contiguous ranges of
slots
as simply the term and value and the endpoints of the range of slots.
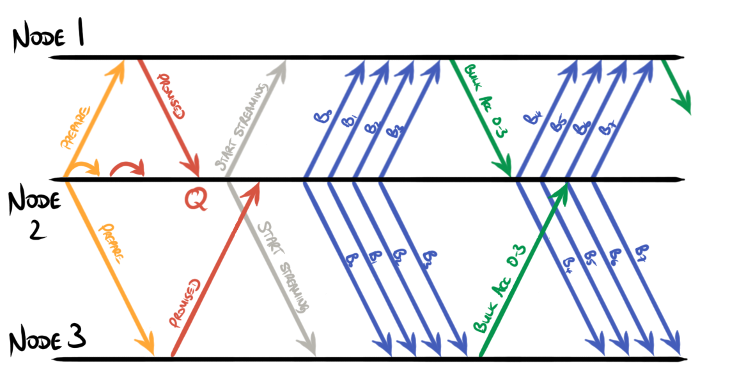
Although TCP presents a byte-by-byte abstraction of a stream of data, it is
usual for implementations to collect batches of bytes together into packets for
transmission. Here, each batch of bytes implies a collection of
proposed+accepted messages for a known (constant) term and a known (constant)
value, for a contiguous range of slots. Since the term and value are constant
for the whole batch, it is possible to process the entire batch as a single
entity and send a single accepted message back for the whole batch, as shown
here:
Furthermore this system supports pipelining, allowing proposals and acceptances to be overlapped:
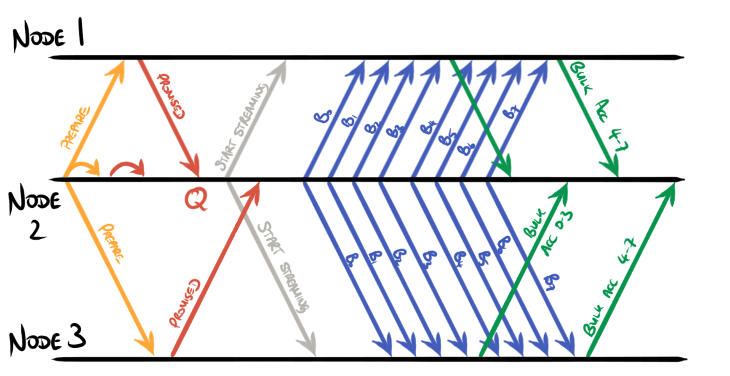
Importantly, the leader and followers need not inspect the bulk data on the way
past. Instead, they must just ensure that it is durably stored before passing
it on to guarantee liveness, and must simply know how much data is flowing in
order to respond with the appropriate acceptances. This dataflow pattern
permits the use of efficient zero-copy mechanisms such as splice() and
sendfile() to manage the data flowing in bulk, with responses that describe
the quantity of data transferred.
A cheaper variant
Typically, to be resilient to f faults, a majority-based replicated state machine requires a factor of 2f+1 more resources than a non-replicated version.
Following the ideas of Cheap Paxos and Harp, in the steady state the bandwidth and storage requirements of a cluster can safely be reduced by partitioning the 2f+1 nodes into a single leader, f active followers and f auxiliary nodes. Because Paxos-based protocols are robust to lost messages, instead of sending the incoming data to all of its 2f peers the leader need only send it to the active followers and not to the auxiliary nodes. The auxiliary nodes are mostly unused so can be cheap and shared between multiple clusters, which reduces the resource-amplification factor to approximately f+1.
In the event of a failure, the cluster returns to a state where it uses all available nodes to make progress, effectively using the auxiliary nodes as tie-breakers, until it can select a different 1+f+f partitioning and return to the cheaper running mode. An automated version of this mechanism is not yet implemented, but it can be manually simulated by selecting the f auxiliary nodes by hand and disconnecting them from the rest of the cluster. In the event of a failure in this setup, manual intervention is required to reconnect enough auxiliary nodes to allow the system to make progress again.
Experimental results
The experimental setup was a pair of AWS EC2 i3.large instances launched in a
placement group in the eu-west-1a availability zone. The two nodes were
configured as part of a three-node cluster, with the third node left
disconnected (as an auxiliary node) in order to maximise the available
bandwidth between the nodes as described above.
A client program was run on the same node as the cluster leader. The client program has two configurable parameters:
- a target bandwidth: a maximum rate at which it sends data to the cluster, and
- the size of each write in bytes.
On each run the client writes data to the cluster as configured. The first 15 seconds of each run were used to ensure the system had reached a reasonably steady state and the performance of the system was measured over the following 45 seconds. A number of runs were performed with a selection of different target bandwidths and write sizes.
Some of the runs failed the first time through, mostly due to the leader rejecting the client because the previous run’s stream had not yet been completely closed. Runs were repeated until successful.
Throughput
In order to measure the system throughput, the client recorded the number of acknowledged bytes and acknowledged writes that it performed in each 45-second test.
| 1 B | 14 B | 20 B | 50 B | 100 B | 200 B | 500 B | 1000 B | |
|---|---|---|---|---|---|---|---|---|
| 5 MB/s | 0.242 | 1.000 | 1.000 | 1.000 | 1.000 | 1.000 | 1.000 | 1.000 |
| 10 MB/s | 0.127 | 1.000 | 1.000 | 1.000 | 1.000 | 1.000 | 1.000 | 1.000 |
| 20 MB/s | 0.111 | 0.901 | 1.000 | 1.000 | 1.000 | 1.000 | 1.000 | 1.000 |
| 50 MB/s | 0.318 | 0.528 | 1.000 | 1.000 | 1.000 | 1.000 | 1.000 | |
| 100 MB/s | 0.269 | 0.695 | 1.000 | 1.000 | 1.000 | 1.000 | ||
| 120 MB/s | 0.540 | 1.000 | 1.000 | 1.000 | 1.000 | |||
| 130 MB/s | 0.531 | 0.845 | 1.000 | 1.000 | 1.000 | |||
| 140 MB/s | 0.434 | 0.791 | 1.000 | 1.000 | 1.000 | |||
| 150 MB/s | 0.462 | 0.906 | 1.000 | 1.000 | 1.000 | |||
| 160 MB/s | 0.419 | 0.854 | 1.000 | 0.997 | 0.999 | |||
| 170 MB/s | 0.381 | 0.683 | 0.985 | 0.999 | 1.002 | |||
| 180 MB/s | 0.338 | 0.605 | 0.989 | 1.000 | 1.000 | |||
| 190 MB/s | 0.357 | 0.719 | 0.888 | 0.999 | 0.990 | |||
| 200 MB/s | 0.304 | 0.568 | 0.920 | 0.988 | 0.991 | |||
| 210 MB/s | 0.306 | 0.552 | 0.862 | 0.940 | 0.942 | |||
| 220 MB/s | 0.313 | 0.607 | 0.798 | 0.898 | 0.900 |
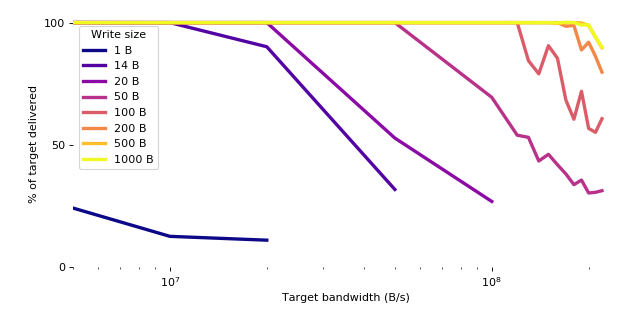
Table 1. Proportion of target bandwidth delivered, by target bandwidth and write size.
The system successfully delivered over 99% of the target bandwidth up to around 20MB/s (160Mb/s) for 20-byte writes, 120MB/s (960Mb/s) for 100-byte writes, and 190MB/s (1.5Gb/s) for 500-byte and 1000-byte writes. There are two limiting factors that come into play above these rates, illustrated by the shaded areas below.
![]()
| 1 B | 14 B | 20 B | 50 B | 100 B | 200 B | 500 B | 1000 B | |
|---|---|---|---|---|---|---|---|---|
| 5 MB/s | 1.211 | 0.357 | 0.250 | 0.100 | 0.050 | 0.025 | 0.010 | 0.005 |
| 10 MB/s | 1.265 | 0.714 | 0.500 | 0.200 | 0.100 | 0.050 | 0.020 | 0.010 |
| 20 MB/s | 2.218 | 1.288 | 1.000 | 0.400 | 0.200 | 0.100 | 0.040 | 0.020 |
| 50 MB/s | 1.136 | 1.320 | 1.000 | 0.500 | 0.250 | 0.100 | 0.050 | |
| 100 MB/s | 1.346 | 1.389 | 1.000 | 0.500 | 0.200 | 0.100 | ||
| 120 MB/s | 1.296 | 1.200 | 0.600 | 0.240 | 0.120 | |||
| 130 MB/s | 1.381 | 1.098 | 0.650 | 0.260 | 0.130 | |||
| 140 MB/s | 1.217 | 1.107 | 0.700 | 0.280 | 0.140 | |||
| 150 MB/s | 1.386 | 1.359 | 0.750 | 0.300 | 0.150 | |||
| 160 MB/s | 1.342 | 1.367 | 0.800 | 0.319 | 0.160 | |||
| 170 MB/s | 1.296 | 1.161 | 0.837 | 0.340 | 0.170 | |||
| 180 MB/s | 1.216 | 1.089 | 0.890 | 0.360 | 0.180 | |||
| 190 MB/s | 1.355 | 1.367 | 0.844 | 0.380 | 0.188 | |||
| 200 MB/s | 1.215 | 1.135 | 0.920 | 0.395 | 0.198 | |||
| 210 MB/s | 1.287 | 1.158 | 0.905 | 0.395 | 0.198 | |||
| 220 MB/s | 1.378 | 1.335 | 0.877 | 0.395 | 0.198 |
Table 2. Write rate (MHz) by target bandwidth and write size.
For smaller writes, the limiting factor was the rate at which writes could be
made in the client. Each write involved an invocation of the write() system
call, which is relatively expensive and could reliably be performed only up to
around 1MHz by the single writer thread in the client.
For larger writes, the limiting factor was the available bandwidth to disk and network, which was around 180MB/s (1.4Gb/s).
Latency
In order to estimate the system’s latency, the client recorded the time taken to perform a selection of consecutive whole round-trips within the 45-second test.
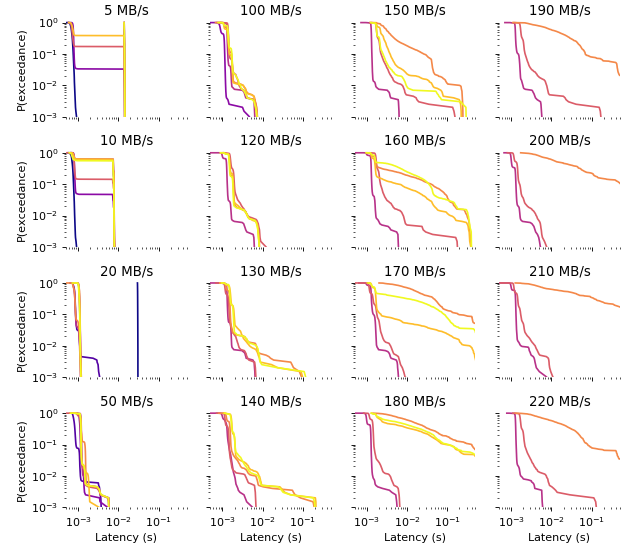
Exceedance probability distribution of latencies
| 1 B | 14 B | 20 B | 50 B | 100 B | 200 B | 500 B | 1000 B | |
|---|---|---|---|---|---|---|---|---|
| 5 MB/s | 0.695 | 14.100 | 0.768 | 14.100 | 0.715 | 14.120 | 0.768 | 14.152 |
| 10 MB/s | 0.715 | 7.480 | 0.807 | 7.521 | 0.803 | 7.514 | 7.465 | 7.410 |
| 20 MB/s | 30.264 | 0.826 | 1.066 | 0.815 | 1.087 | 0.813 | 1.081 | 1.049 |
| 50 MB/s | 0.806 | 1.100 | 1.196 | 1.174 | 1.175 | 1.156 | 1.171 | |
| 100 MB/s | 0.926 | 1.301 | 1.398 | 1.384 | 1.318 | 1.383 | ||
| 120 MB/s | 1.256 | 1.612 | 1.520 | 1.507 | 1.476 | |||
| 130 MB/s | 1.297 | 1.197 | 1.455 | 1.569 | 1.514 | |||
| 140 MB/s | 1.223 | 1.185 | 1.484 | 1.704 | 1.670 | |||
| 150 MB/s | 1.293 | 1.758 | 3.454 | 2.206 | 1.758 | |||
| 160 MB/s | 1.270 | 1.727 | 1.666 | 1.574 | 1.690 | |||
| 170 MB/s | 1.279 | 1.200 | 19.407 | 1.638 | 1.693 | |||
| 180 MB/s | 1.013 | 1.392 | 15.176 | 2.787 | 6.501 | |||
| 190 MB/s | 1.269 | 1.737 | 14.695 | 1168.133 | 1007.121 | |||
| 200 MB/s | 1.014 | 1.342 | 14.791 | 1414.131 | 1344.016 | |||
| 210 MB/s | 1.248 | 1.239 | 30.966 | 1342.250 | 1354.383 | |||
| 220 MB/s | 1.280 | 1.717 | 13.732 | 1274.763 | 1474.827 |
Table 4. Median latency (ms) by target bandwidth and write size.
| 1 B | 14 B | 20 B | 50 B | 100 B | 200 B | 500 B | 1000 B | |
|---|---|---|---|---|---|---|---|---|
| 5 MB/s | 0.819 | 14.453 | 14.315 | 14.459 | 14.356 | 14.487 | 14.350 | 14.474 |
| 10 MB/s | 0.825 | 7.901 | 7.838 | 7.926 | 7.872 | 7.913 | 7.877 | 7.845 |
| 20 MB/s | 30.728 | 1.103 | 1.151 | 1.100 | 1.154 | 1.116 | 1.141 | 1.135 |
| 50 MB/s | 1.147 | 1.375 | 1.364 | 1.479 | 1.567 | 1.790 | 1.473 | |
| 100 MB/s | 1.200 | 1.700 | 2.597 | 3.261 | 3.290 | 2.780 | ||
| 120 MB/s | 1.655 | 4.282 | 4.211 | 4.173 | 4.191 | |||
| 130 MB/s | 1.703 | 2.511 | 6.934 | 4.701 | 6.870 | |||
| 140 MB/s | 2.002 | 3.695 | 6.679 | 8.116 | 7.721 | |||
| 150 MB/s | 1.659 | 7.590 | 201.785 | 43.169 | 9.521 | |||
| 160 MB/s | 1.670 | 8.041 | 310.004 | 118.702 | 329.858 | |||
| 170 MB/s | 1.755 | 3.873 | 993.406 | 352.713 | 551.989 | |||
| 180 MB/s | 1.398 | 3.758 | 1128.342 | 670.293 | 687.638 | |||
| 190 MB/s | 1.953 | 7.619 | 665.866 | 1687.889 | 1697.058 | |||
| 200 MB/s | 1.648 | 4.163 | 1534.855 | 1706.051 | 1737.592 | |||
| 210 MB/s | 1.736 | 3.919 | 1078.736 | 1699.089 | 1747.118 | |||
| 220 MB/s | 1.728 | 7.450 | 950.298 | 1735.124 | 1719.195 |
Table 5. 99th percentile latency (ms) by target bandwidth and write size.
For target bandwidths between 20MB/s (160Mb/s) and 170MB/s (1.3Gb/s) the system achieved a median latency better than 2ms at most write sizes. Similarly, the 99th percentile latency was better than 10ms between 20MB/s (160Mb/s) and 140MB/s (1.1Gb/s). As the bandwidth limit of 180MB/s (1.4Gb/s) was approached for larger write sizes the measured latency increased substantially due to the increasingly large queue lengths throughout the system.
At rates below 20MB/s the latency was also substantially higher in certain experiments. The reasons for this are unknown.
CPU Usage
The CPU usage of both leader and follower nodes was measured by calling
getrusage() at the start and end of each run in order to obtain the CPU time
used by each process broken down into user and system (i.e. kernel)
components. These numbers were converted into percentages by dividing them by
the total length of each run.
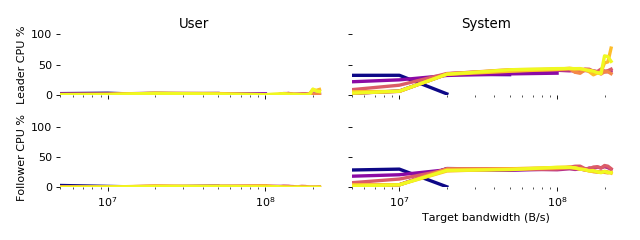
The user CPU usage was trivial for all runs on both leader and follower. The system CPU usage was under 50% for all runs on both leader and follower until the bandwidth limit of 180MB/s (1.4Gb/s) was reached, at which point overflowing queues are believed to have caused the spike in CPU usage.
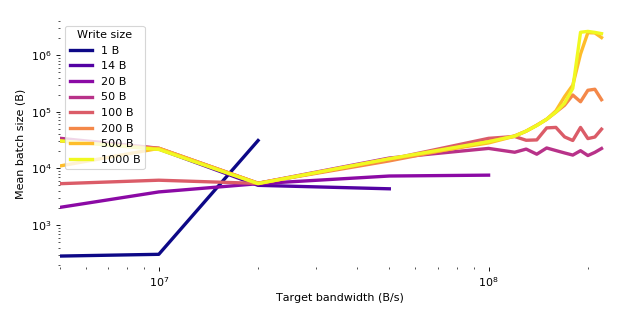
Batching
Because TCP is used to transmit data between its participants, it is expected
that messages will be coalesced and fragmented according to network conditions.
Since proposed+accepted messages for stream-content values are each 1 byte
long, this effectively creates a low-level mechanism for batching such
messages together. The work performed by the application-level code on each
batch is essentially constant: it is not necessary to split each batch back
into individual messages in order to process them further. Importantly, the
batching, and any subsequent fragmentation, is performed on a per-connection
basis according to the network conditions for that connection, and can be tuned
as if it were any other TCP connection.
The mean batch size was calculated by dividing the size of the acknowledged data by the number of discrete acknowledgements.
| 1 B | 14 B | 20 B | 50 B | 100 B | 200 B | 500 B | 1000 B | |
|---|---|---|---|---|---|---|---|---|
| 5 MB/s | 283 | 32057 | 2043 | 33972 | 5358 | 30397 | 10984 | 30707 |
| 10 MB/s | 304 | 21981 | 3837 | 22658 | 6176 | 22591 | 22505 | 21554 |
| 20 MB/s | 30989 | 5014 | 5360 | 5457 | 5423 | 5467 | 5446 | 5364 |
| 50 MB/s | 4356 | 7324 | 15197 | 14403 | 13549 | 14642 | 14790 | |
| 100 MB/s | 7587 | 22488 | 33857 | 29587 | 28084 | 29630 | ||
| 120 MB/s | 19238 | 36484 | 37479 | 36974 | 37047 | |||
| 130 MB/s | 21885 | 31315 | 45462 | 45243 | 45486 | |||
| 140 MB/s | 17772 | 31755 | 57795 | 57278 | 57053 | |||
| 150 MB/s | 22899 | 51768 | 73525 | 73432 | 73582 | |||
| 160 MB/s | 20609 | 52795 | 98218 | 103453 | 98354 | |||
| 170 MB/s | 18697 | 35880 | 130114 | 184428 | 141025 | |||
| 180 MB/s | 17147 | 31027 | 196886 | 293882 | 258483 | |||
| 190 MB/s | 20501 | 52749 | 149782 | 1042408 | 2522109 | |||
| 200 MB/s | 16841 | 33530 | 238816 | 2480956 | 2612452 | |||
| 210 MB/s | 19158 | 35705 | 249076 | 2455871 | 2510222 | |||
| 220 MB/s | 22414 | 49161 | 162778 | 2032740 | 2387092 |
Table 3. Mean acknowledged batch size (B) by target bandwidth and write size.
Related work
There have been a number of recent developments of high-throughput Paxos implementations, including:
-
Speculative Paxos by Ports et al, 2015.
-
NOPaxos by Li et al, 2016.
All of the above make use of specialised network hardware and achieve good throughput (in the region of 100kHz-250kHz) and very low latency (10μs-100μs) as a result. In contrast,
-
Zero-copy Paxos (ZCP) achieves throughput in excess of 1MHz where bandwidth permits, but with a typical latency of 1-10ms. It spends a negligible amount of CPU time running the protocol itself compared with the (unavoidable) cost of simply moving data around within the
splice(),sendfile()andfsync()system calls. -
ZCP is applicable in situations, such as public clouds, where such specialised hardware is not available. The results shown above were achieved during an experimental run of approximately 3 hours using AWS EC2 instances at a cost of less than USD1.
-
In the experimental setup, ZCP was I/O bound for writes larger than approximately 200B. For smaller writes, the limiting factor was the frequency at which the client could invoke the
write()system call. -
ZCP durably writes its data to NVMe storage; NOPaxos operates entirely in-memory, and the situation with the other protocols above is not known.
-
ZCP supports online reconfiguration allowing for maintenance and replacement of failed nodes.
Future work
-
ZCP currently does not use the casting vote mechanism of UPaxos to guarantee stall-free reconfigurations, but this should be added.
-
The experiments were run using the idea of Cheap Paxos to reduce the resource requirements when not suffering a failure, but this would currently require manual intervention to recover if a failure had occurred. This should be fixed.
-
The experiments used the standard Linux TCP stack with a very limited amount of tuning, and did not use the fastest available EC2 instances for cost reasons. It would certainly be interesting to repeat these experiments in a more heavily tuned and higher-performance environment, and to investigate the effects of using a custom TCP stack or an alternative connection-based protocol.
Conclusion
Zero-copy Paxos accepts streams of bytes from a client and stores them durably, distributed redundantly across a cluster. In each stream, the stored data is always an initial subsequence of the data sent by the client, which allows the client to write multi-byte messages without needing to account for gaps in the stored data.
Zero-copy Paxos makes heavy use of a network protocol, TCP, that provides a streaming abstraction, guaranteeing intra-connection message ordering and with the ability to merge and split packets as necessary. The standard Linux TCP stack was used, and achieved good performance, but other connection-oriented protocols and network stacks may yield even better results.
Existing hardware and low-level software are heavily optimised for processing
streams of data without inspecting them in detail. ZCP reduces each proposed
message to a single byte, and sends the corresponding accepted messages in
bulk, represented as a simple count of the number of proposals accepted. In
doing so it removes the need to inspect the data, permitting the use of
high-performance zero-copy techniques.